Product Description
| Description:
Forced vibration and resonance are often used in engineering and science research. For example, in fields of architecture and mechanicalengineering, resonance is unfavorable and often needs to be avoided to ensure the quality of construction. However, in some petrochemical processing enterprises, principle of resonance is frequently used to detect fluid density and fluid level. Therefore, forced vibration and resonance are important laws of physics, and are getting more attention in physics and engineering.
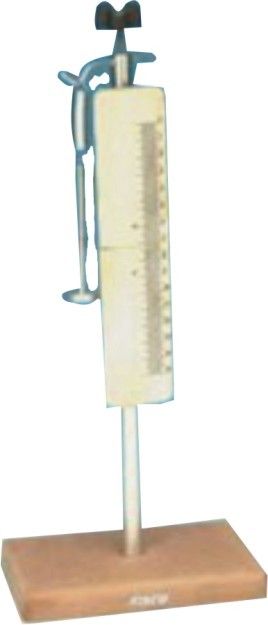
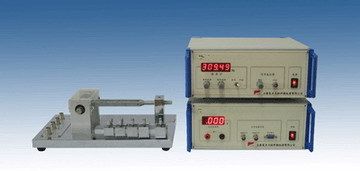
The apparatus takes the tuning fork vibration system as the study object, and takes the electromagnetic force of excitation coil as the excitationforce, and piezoelectric transducing chip as the amplitude monitoring sensor, to measure relationship between the vibration amplitude and the frequency of the driving force. It is equipped with an additional PC acquisition and analysis system, and it can automatically scan the resonance curve, and measure the mass of weight b linear fitting method.
EXPERIMENTS:
. 1. Study the tuning vibrating system in relation of amplitude and forced frequency under the action of external periodic force, measure and draw the resonance curve of vibrating system and find out the resonance frequency and vibration acutance of vibrating system, and then through the computer automatically analyze the curve based on the real time measured curve by computer. Interface software can also be used to automatically collect data of curve and to analyze the hardness of vibration system.
2. Measure the relationship between the vibration of tuning fork and mass of symmetric double arms and find out the relation formula of tuning fork resonance frequency and symmetric mass attached on certain position on the double arms of tuning fork.
3. 3. Measure mass of a pair of mass blocks attached on the fixed position on tuning fork by way of measuring the resonance frequency, and automatically analyze with the data collection software. The apparatus has obvious physics phenomenon and reliable experimental data and is applicable to fundamental physics experiment, design and research experiment as well as lecture experiment.
Details: | Fork natural frequency: | 250Hz | | LF signal generator frequency range: | 180-280Hz, resolution 0.01Hz, digital display | | AC digital voltmeter: | range 0~1.999V, resolution 0.001V | | Piezoceramic transducer: | Diameter of base plate 27mm, diameter of piezoelectric ceramic 20mm, thickness of chip 0.3mm | |
Advanced Measurement and Real-Time DisplayEquipped with piezoelectric or LVDT sensors, this apparatus provides highly accurate vibration and displacement measurements in real time. Data is visualized both on a digital PC interface via USB 2.0 and through analog dials, allowing users to monitor amplitude and frequency with clarity. The software enhances learning with on-the-go resonance curve plotting, making it ideal for university labs.
Versatile and Safe Laboratory ToolThe system features variable speed control (60-3000 RPM), electronic speed adjustments, and emergency stop for maximum safety. Removable masses and manual frequency adjustment offer flexibility for a range of experiments on forced vibration and resonance. Constructed from robust powder-coated mild steel and aluminium, it provides stability and reduces vibrations thanks to anti-slip pads and isolated feet.
Comprehensive Data Acquisition and AnalysisSeamlessly integrating with Windows-based acquisition software, the apparatus allows high-frequency (up to 1000 samples/second) data collection. Features like graph plotting, peak detection, and export to CSV support in-depth analysis and easy documentation of laboratory results. The real-time digital interface transforms experimental data into insightful, visual learning experiences.
FAQ's of FORCED VIBRATION AND RESONANCE EXPERIMENTAL APPARATUS (COMPUTER ACQUISITION):
Q: How does the forced vibration and resonance apparatus measure amplitude and displacement?
A: The apparatus uses precision piezoelectric or LVDT vibration sensors to detect displacement and amplitude accurately within a range of 0-50 mm. Data is displayed both digitally, through the computer interface, and analog via pointer scales, ensuring reliable measurement during experiments.
Q: What are the primary benefits of using this system in a university or engineering laboratory?
A: This apparatus provides hands-on experience with forced vibration and resonance phenomena, promoting a thorough understanding of mechanical system dynamics. The combination of real-time data acquisition, advanced graph plotting, and user-friendly controls supports comprehensive experimental analysis and enhances educational outcomes.
Q: How is the resonance curve displayed and analyzed using the apparatus?
A: Resonance curves are displayed instantly on the PC through the Windows-compatible software, which plots amplitude versus frequency in real time. The software helps in identifying resonance peaks and facilitates detailed analysis by logging, exporting, and reviewing the collected data.
Q: When is manual operation preferable over computer-based control?
A: Manual frequency adjustment is useful for quick setup, demonstration purposes, or when teaching frequency response concepts interactively. It complements the precise electronic speed control, allowing users to explore resonance conditions at their own pace before switching to automated data acquisition.
Q: Where can this apparatus be effectively utilized?
A: The apparatus is specifically designed for laboratory environments in universities, engineering colleges, and research institutes. Its robust design and built-in safety features make it suitable for demonstration, instruction, and structured experimentation in vibration and dynamics courses.
Q: What safety measures are integrated into the system?
A: Safety is ensured by features such as an emergency stop button, overload protection, and anti-slip, vibration-isolated feet. These components prevent equipment damage and protect users during high-speed or large-amplitude experiments.


 English
 Spanish
 French
 German
 Italian
 Chinese (Simplified)
 Japanese
 Korean
 Arabic
 Portuguese